The past few weeks I have been working on quite a large project. The aims of the project were thus:
Every post will deal with each bullet point in turn. As I have not entirely completed the data for North American zoos, only the European zoos' data will be available for use for the moment.
Of course, there are a few caveats as always with this kind of study:
1. This bullet point will concentrate on European zoos for now, and the results will later be compared to North American zoos to see if there is any difference. The 13 European zoos that were used for the data were the following:
While Colchester Zoo may seem a strange inclusion, it was added in due to time constraints but also to eliminate anomalies.
The classes included in the study were Mammals, Birds and Reptiles and Amphibians. Fish were omitted for several reasons:
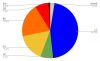
So, here are the results:
Chester Zoo
DD/NE: 3.9%
LC: 45.6%
NT: 8.2%
VU: 13.4%
EN: 16.4%
CR: 12.1%
EW: 0.3%
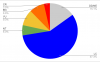
ZooParc de Beauval
DD/NE: 9.5%
LC: 48.1%
NT: 10.2%
VU: 11.2%
EN: 12.1%
CR: 9.0%
EW: 0%
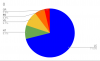
Zoo Berlin
DD/NE: 3.2%
LC: 62.8%
NT: 9.4%
VU: 10.8%
EN: 9.6%
CR: 3.8%
EW: 0.4%
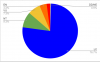
Tierpark Berlin
DD/NE: 5.9%
LC: 49.9%
NT: 11.8%
VU: 14.6%
EN: 10.4%
CR: 7.2%
EW: 0.2%
Pairi Daiza
DD/NE: 4.9%
LC: 54.9%
NT: 7.2%
VU: 15.3%
EN: 9.5%
CR: 7.2%
EW: 0.9%
Zoo Zurich
DD/NE: 2.6%
LC: 60.8%
NT: 6.7%
VU: 11.3%
EN: 12.9%
CR: 5.2%
EW: 0.5%
Colchester Zoo
DD/NE: 5.1%
LC: 40.9%
NT: 7.3%
VU: 19.7%
EN: 16.8%
CR: 10.2%
EW: 0%
Tiergarten Schoenbrunn
DD/NE: 5.0%
LC: 59.1%
NT: 6.6%
VU: 11.6%
EN: 11.2%
CR: 5.8%
EW: 0.8%
Zoo Wroclaw
DD/NE: 11.3%
LC: 54.2%
NT: 6.9%
VU: 12.3%
EN: 10.5%
CR: 4.5%
EW: 0.4%
Diergaarde Blijdorp
DD/NE: 2.7%
LC: 51.6%
NT: 8.0%
VU: 10.7%
EN: 12.9%
CR: 14.2%
EW: 0%
Zoo Praha
DD/NE: 6.8%
LC: 59.8%
NT: 8.4%
VU: 10.4%
EN: 9.1%
CR: 5.3%
EW: 0.2%
Zoo Plzen
DD/NE: 4.6%
LC: 68.8%
NT: 6.8%
VU: 9.6%
EN: 6.8%
CR: 3.2%
EW: 0.3%
Zoo Leipzig
DD/NE: 4.3%
LC: 57.3%
NT: 3.9%
VU: 10.2%
EN: 15.3%
CR: 8.6%
EW: 0.4%
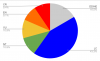
So, on average in major European zoos:
5.68% of species are either Data Deficient or Not Evaluated
56.10% of species are Least Concern
9.18% of species are Near Threatened
11.69% of species are Vulnerable
10.62% of species are Endangered
6.41% of species are Critically Endangered
And 0.32% of species are Extinct in the Wild.
Here is my data table for European Zoos:
Zoo Study 1
I will draw some conclusions and rankings based on this information in the next post.
Sorry about the overload of data. At first I was thinking about going all in and including class-specific data in the first post but later decided that that will follow later") .
.
- To, with some degree of accuracy, determine the percentages of the species found in zoos of different levels of endangerment.
- To, with the data obtained to achieve the above bullet point, compare two continents (North America and Europe) once all the data has been collected in the above regard, as well as drawing comparisons on a zoo-to-zoo basis.
- To, again with the same data, investigate the proportions of different classes found in zoos and compare it to the natural average (in the wild)
- And finally to take all the data collected and use it to compare zoo's percentages with the wild's percentages and hence conclude as to whether zoos are carrying out the conservational work they pledge to do.
Every post will deal with each bullet point in turn. As I have not entirely completed the data for North American zoos, only the European zoos' data will be available for use for the moment.
Of course, there are a few caveats as always with this kind of study:
- I will be using Zootierliste for European zoos and species lists written on this website for American zoos to collect data on the endangerment of the species in zoos. While neither are entirely reliable sources of information, based on previous calculations the study would be swayed by ±0.1% on the final figures given the likely unreliability of these sources.
- There might be a degree of human error involved. I have counted and sifted through large lists - I may have missed one or two species during the data collection stage. This shouldn't influence the study much, but is still something to be aware of. I also had to plug the collected data into an Excel document with pre-prepared functions. Minor errors may have been made in this process. The document was then copied and pasted into a Google Sheets document to make it easier to share.
- There is a slight issue with comparing the wild averages and the zoo averages in that in the case of the zoo, I am issuing the percentages zoo-by-zoo meaning there will be species repetitions when the zoo data is looked at across all the zoos analysed. In contrast, the wild averages deal with different species with no repeats. However, unless level of endangerment affects number of holders drastically, this shouldn't be a problem.
1. This bullet point will concentrate on European zoos for now, and the results will later be compared to North American zoos to see if there is any difference. The 13 European zoos that were used for the data were the following:
- Chester Zoo
- ZooParc de Beauval
- Zoo Berlin
- Tierpark Berlin
- Colchester Zoo
- Zoo Leipzig
- Zoo Zurich
- Zoo Wroclaw
- Zoo Praha
- Zoo Plzen
- Pairi Daiza
- Diergaarde Blijdorp
- Tiergarten Schoenbrunn
While Colchester Zoo may seem a strange inclusion, it was added in due to time constraints but also to eliminate anomalies.
The classes included in the study were Mammals, Birds and Reptiles and Amphibians. Fish were omitted for several reasons:
- Reliable information on fish holdings in zoos is hard to come by due to a number of reasons.
- Not many fish species have been assessed by the IUCN.
- There is high variation in the number of fish species held in different zoos depending on whether or not they have a facility focusing on them
So, here are the results:
Chester Zoo
DD/NE: 3.9%
LC: 45.6%
NT: 8.2%
VU: 13.4%
EN: 16.4%
CR: 12.1%
EW: 0.3%
ZooParc de Beauval
DD/NE: 9.5%
LC: 48.1%
NT: 10.2%
VU: 11.2%
EN: 12.1%
CR: 9.0%
EW: 0%
Zoo Berlin
DD/NE: 3.2%
LC: 62.8%
NT: 9.4%
VU: 10.8%
EN: 9.6%
CR: 3.8%
EW: 0.4%
Tierpark Berlin
DD/NE: 5.9%
LC: 49.9%
NT: 11.8%
VU: 14.6%
EN: 10.4%
CR: 7.2%
EW: 0.2%
Pairi Daiza
DD/NE: 4.9%
LC: 54.9%
NT: 7.2%
VU: 15.3%
EN: 9.5%
CR: 7.2%
EW: 0.9%
Zoo Zurich
DD/NE: 2.6%
LC: 60.8%
NT: 6.7%
VU: 11.3%
EN: 12.9%
CR: 5.2%
EW: 0.5%
Colchester Zoo
DD/NE: 5.1%
LC: 40.9%
NT: 7.3%
VU: 19.7%
EN: 16.8%
CR: 10.2%
EW: 0%
Tiergarten Schoenbrunn
DD/NE: 5.0%
LC: 59.1%
NT: 6.6%
VU: 11.6%
EN: 11.2%
CR: 5.8%
EW: 0.8%
Zoo Wroclaw
DD/NE: 11.3%
LC: 54.2%
NT: 6.9%
VU: 12.3%
EN: 10.5%
CR: 4.5%
EW: 0.4%
Diergaarde Blijdorp
DD/NE: 2.7%
LC: 51.6%
NT: 8.0%
VU: 10.7%
EN: 12.9%
CR: 14.2%
EW: 0%
Zoo Praha
DD/NE: 6.8%
LC: 59.8%
NT: 8.4%
VU: 10.4%
EN: 9.1%
CR: 5.3%
EW: 0.2%
Zoo Plzen
DD/NE: 4.6%
LC: 68.8%
NT: 6.8%
VU: 9.6%
EN: 6.8%
CR: 3.2%
EW: 0.3%
Zoo Leipzig
DD/NE: 4.3%
LC: 57.3%
NT: 3.9%
VU: 10.2%
EN: 15.3%
CR: 8.6%
EW: 0.4%
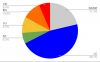
So, on average in major European zoos:
5.68% of species are either Data Deficient or Not Evaluated
56.10% of species are Least Concern
9.18% of species are Near Threatened
11.69% of species are Vulnerable
10.62% of species are Endangered
6.41% of species are Critically Endangered
And 0.32% of species are Extinct in the Wild.
Here is my data table for European Zoos:
Zoo Study 1
I will draw some conclusions and rankings based on this information in the next post.
Sorry about the overload of data. At first I was thinking about going all in and including class-specific data in the first post but later decided that that will follow later
.
Last edited:

")