You are using an out of date browser. It may not display this or other websites correctly.
You should upgrade or use an alternative browser.
You should upgrade or use an alternative browser.
American Herping: A Guide to Reptiles and Amphibians in US Zoos
- Thread starter Coelacanth18
- Start date
SusScrofa
Well-Known Member
To add to this wonderful thread from @Coelacanth18, I've compiled a list of reptile specialist facilities across the USA, some of which were already mentioned on this thread. These facilities range from small and obscure to large and famous. Many are alligator farms.
There are some facilities with very large reptile collections that were excluded because they have a heavy amount of non-reptile animals. I've also excluded nature centers and sea turtle hospitals even though many of them have an almost exclusively reptile-based collection including native species that rarely appear in mainstream zoo facilities.
At the same time a few of these that are included have developed a large non-reptile collection to the point where I debated putting them on (Arkansas Alligator Farm and Gators & Friends in particular), but since they are billed as a reptile-focused zoo, I opted to include them.
Here is a total list of what I've come up with, ordered by state. I'm still sure I missed some really small gator farms in middle of the rural deep south...
ALABAMA
Alligator Alley (Summerdale)
ARIZONA
Goldfield Mines Superstition Serpentarium (Apache Junction)
Phoenix Herpetological Sanctuary (Scottsdale)
Rattlesnake Ranch (Cave Creek)
ARKANSAS
Arkansas Alligator Farm & Petting Zoo (Hot Springs)
Snake World (Berryville)
CALIFORNIA
EcoVivarium (Escondido)
The Reptile Zoo (Fountain Valley)
COLORADO
Colorado Gators Reptile Park (Mosca)
CONNECTICUT
Riverside Reptiles Education Center (Enfield)
FLORIDA
Alligator & Wildlife Discovery Center (Madeira Beach)
Croc Encounters (Tampa)
Everglades Alligator Farm (Homestead)
Gator Golf Adventure Park (Orlando)
Gator Park (Miami)
Gatorama (Palmdale)
Gatorland (Orlando)
Iguanaland (Punta Gorda)
Reptile Discovery Center (DeLand)
Reptile World Serpentarium (St. Cloud)
Sawgrass Recreation Park (Weston)
St. Augustine Alligator Farm Zoological Park (St. Augustine)
IDAHO
Idaho Reptile Zoo (Boise)
KENTUCKY
Kentucky Reptile Zoo (Slade)
LOUISIANA
Gator Country/Natchitoches Alligator Park (Natchitoches)
Gators & Friends (Greenwood)
Greenwood Gator Farm (Gibson)
Kliebert & Sons Gator Tours (Ponchatoula)
MICHIGAN
Critchlow Alligator Sanctuary (Athens)
The Reptarium (Utica)
MINNESOTA
Reptile & Amphibian Discovery Zoo (Medford)
Snake Discovery (Maplewood)
NEW MEXICO
American International Rattlesnake Museum (Albuquerque)
NEW YORK
Prehistoric World (Perry)
NORTH CAROLINA
OBX Lizard Land (Currituck)
PENNSYLVANIA
Clyde Peeling’s Reptiland (Allenwood)
SOUTH CAROLINA
Alligator Adventure (North Myrtle Beach)
Edisto Island Serpentarium (Edisto Island)
Reptile Lagoon (Hamer)
SOUTH DAKOTA
Reptile Gardens (Rapid City)
TEXAS
Crocodile Encounter (Angleton)
Gator Country (Beaumont)
Rattlers & Reptiles (Fort Davis)
Reptilandia (Johnson City)
Texas Reptile Zoo (Bastrop)
UTAH
Scales & Tails Utah (Kearns)
WASHINGTON
Bremerton Bug & Reptile Museum (Bremerton)
Reptile Zoo (Monroe)
WISCONSIN
Alligator Alley Adventures (Wisconsin Dells)
Jack R. Facente Serpentarium (Oshkosh)
That's a total of 50 facilities. Not surprisingly, Florida leads the pack with 12 collections.
Hello all ") with help from our industrious moderator @TeaLovingDave there is now a table of contents on the first post of this thread, with titled links to every group discussed in the guide. This means going forward everyone will be able to immediately jump to a species or family of interest, rather than having to locate it within the thread. Happy browsing!
with help from our industrious moderator @TeaLovingDave there is now a table of contents on the first post of this thread, with titled links to every group discussed in the guide. This means going forward everyone will be able to immediately jump to a species or family of interest, rather than having to locate it within the thread. Happy browsing!

Like this sleepy Gila Monster, I can finally rest on my laurels for a bit
Taken at the Potter Park Zoo by @evilmonkey239
with help from our industrious moderator @TeaLovingDave there is now a table of contents on the first post of this thread, with titled links to every group discussed in the guide. This means going forward everyone will be able to immediately jump to a species or family of interest, rather than having to locate it within the thread. Happy browsing!Like this sleepy Gila Monster, I can finally rest on my laurels for a bit
Taken at the Potter Park Zoo by @evilmonkey239
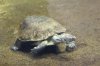
Malayan Flat-shelled Turtle (Notochelys platynota) – was only briefly signed at Zoo Knoxville, never visually reported anywhere
I did see this species at Zoo Knoxville in 2021 and I believe they still have them.
Meant to post when this conversation was still fresh haha, but I *think* this is our culprit. In a tank with 5 other species and turtle ID isn't my forte, but here you go:Glad someone got tothey were signed when I visited in late 2021, but unfortunately I didn't see any. From what I've been able to tell, they were no longer signed by sometime in 2022; it's definitely possible that they are still there though, maybe even on display again.

As an aside, this was visible in Knoxville's turtle greenhouse from the deck. I haven't been back since this May 2021 visit, but I imagine they are still in the greenhouse. Almost all of Knoxville's rarer turtle species were in there, if not on exhibit elsewhere. I also saw the species on exhibit outdoors at Zoo Atlanta in 2020. (Well, I saw their exhibit - my memory is failing me as to whether I actually saw the animal or not). I formerly saw the species exhibited at Oklahoma City, which I believe doesn't have them anymore, and behind the scenes at Cameron Park Zoo - not sure if they're still there. Regardless, this remains a difficult animal to see on-exhibit and I truly hope that a breeding program for them is more successful than it currently has been.Arakan Forest Turtle (H. depressa) – Rare, Possibly Not on Display
Found in jungle-laden hills of Burma and Bangladesh, this turtle was thought to be extinct for nearly a century before one was found in a Burmese market in 1994. A wild population was eventually discovered in 2009 followed potentially by another in 2015, but this remains a very elusive and rare turtle. There used to be a formal breeding program for this species in US zoos, but it seems to have been largely unsuccessful and few zoos hold them now. There have been isolated successes – notably Zoo Atlanta was the only successful breeder back in the 2000’s, followed by the Turtle Conservancy in California in 2017 and the Tennessee Aquarium in 2023. While the aquarium may still have the offspring on display in the turtle nursery, it’s unclear if anywhere still has adult turtles on display.

Attachments
Meant to post when this conversation was still fresh haha, but I *think* this is our culprit.
Thanks! Yeah that doesn't look like any of the other species signed for that enclosure, and does look roughly right for Malayan Flat-shelled.
As an aside, this was visible in Knoxville's turtle greenhouse from the deck. I haven't been back since this May 2021 visit, but I imagine they are still in the greenhouse. Almost all of Knoxville's rarer turtle species were in there, if not on exhibit elsewhere. I also saw the species on exhibit outdoors at Zoo Atlanta in 2020. (Well, I saw their exhibit - my memory is failing me as to whether I actually saw the animal or not). I formerly saw the species exhibited at Oklahoma City, which I believe doesn't have them anymore
I can confirm that in December 2021 it wasn't signed in Knoxville's turtle greenhouse (I didn't see any unsigned either, but that doesn't mean much
finding turtles in there is a challenge). Interesting to know they had one visible at some point recently!Species lists from Atlanta in 2021 and 2023 were missing Arakan, so pretty sure they aren't on display there anymore. I can also confirm Oklahoma City did not display them in 2021; the Island Life exhibit where they were previously displayed was within the construction zone for the new African area. That is also where some of the only coqui frogs on display in the US were a few years ago

Edit: Also thanks for reporting that Colombian giant toad (Rhaebo blombergi) find at Saint Louis. I discovered after my amphibian write-up that the zoo is involved with amphibian conservation work in Ecuador (Fundacion Jambatu), which I'm guessing is how they end up with these rare Neotropical frogs.
Saint Louis Zoo | Center for Ecuadorian Amphibian Conservation
Last edited:
Torgos
Well-Known Member
For Arakans the best likelihood may be to go to Tennessee Aquarium who hold multiple animals but I don't know if they are on exhibit. They have a lot of animals behind scenes.
Atlanta has Mona coquis on exhibit but good luck finding them They are between the Pilbara skinks and the Papuan pythons - or they were last week
Atlanta has Mona coquis on exhibit but good luck finding them
They are between the Pilbara skinks and the Papuan pythons - or they were last week King of Komodo Dragons
Well-Known Member
I am certain those Mona Coqui's don't exist at this point or are invisible! I spent over 30 minutes looking for them at Atlanta and back when they were at Miami, I spent probably even longer over the course of 3 trips haha, one of these days I'll finally catch them hopefully!For Arakans the best likelihood may be to go to Tennessee Aquarium who hold multiple animals but I don't know if they are on exhibit. They have a lot of animals behind scenes.
Atlanta has Mona coquis on exhibit but good luck finding them
Any relevance to this story. I was under the impressie the new male Galapagos tortoise Abrazo was to be introduced to the 2 Philly females for breeding and getting the first new generation of Western Santa Cruz Galapagos born here since ... a good number of years. All at the recommendation of the SSP. Anyone with more info?The birds section is going to take a while.
Incidentally--at my last visit to the Philadelphia Zoo a couple months ago, I saw what I think was their male Galapagos tortoise trying to mate with one of the female Aldabras (they share a yard).
@Coelacanth18: how do you feel after the global Zootierliste news today, knowing that if you waited a year to start this thread it'd be about twenty times easier
@Coelacanth18: how do you feel after the global Zootierliste news today, knowing that if you waited a year to start this thread it'd be about twenty times easier
That's assuming data from everywhere gets put in and is correct
")
@Coelacanth18: how do you feel after the global Zootierliste news today, knowing that if you waited a year to start this thread it'd be about twenty times easier
The phrase "back in my day" comes to mind
... so I guess old is what I feel like!Honestly I'm kind of glad that a global Zootierliste didn't exist until after I already did this project; cataloguing what species were around was the genesis of it, and if that wasn't necessary or useful to anybody I may have decided a project like this wasn't worth it - and then nobody would have gotten all the other information I provided like ID help, breeding and husbandry, behavior, private trade status, comparison with similar species, conservation programs, etc. All that stuff took equally as long to research as the data compiling took to do (some of which would have been unavoidable anyway), and I'd like to think people found it all valuable and worthwhile
Tree Vipers
We’ll now switch from watching our step to looking over our heads. Thought the canopy would be safer? Think again
Bothriechis – Palm Pitvipers
Colorful tree vipers from the Americas.
Eyelash Viper (Bothriechis schlegelii) – Very Common to Abundant
This is one of the three most common exotic hots in American zoos, alongside king cobras and Gaboon vipers. Found in shady ravines across tropical Latin America, the eyelashes on these small vipers are fashioned from modified scales. They come in a variety of colors, the most iconic of which is a bright gold (seen below).

Taken at the Audubon Zoo by @geomorph
Other Bothriechis species:
Rowley's Palm Pitviper (B. rowleyi) – Uncommon
Yellow-blotched Palm Pitviper (B. aurifer) – Rare
Side-striped Palm Pitviper (B. lateralis) – Rare
As mentioned by @SwampDonkey in the Jacksonville Zoo News 2024 thread, the facility now holds a March's palm pit viper/Honduran palm pit viper (Bothriechis marchi).
splendens
Well-Known Member
I do not believe this has been mentioned here, but a Papuan pygmy mulga
Pseudechis rossignolii is owned by the Phoenix Herpetological Society (presumably on display) and was mentioned in a different thread using the scientific name. I recently saw their individual during the Sacramento Reptile Show when they brought some of their collection to display. I know that this was facility was not included but this seems like a pretty rare species as I found barely any other mentions of it on zoochat.
Pseudechis rossignolii is owned by the Phoenix Herpetological Society (presumably on display) and was mentioned in a different thread using the scientific name. I recently saw their individual during the Sacramento Reptile Show when they brought some of their collection to display. I know that this was facility was not included but this seems like a pretty rare species as I found barely any other mentions of it on zoochat.
The Nashville Zoo apparently has had several other galliwasp species in recent years, and they might still have them.Family Diploglossidae – Galliwasps
Closely related to the anguids, these lizards are mostly found on the Caribbean island of Hispaniola. There is one species I found in American zoos:
Haitian Giant Galliwasp (Caribicus warreni, formerly Celestes warreni) – Uncommon
Only found in a handful of zoos, this endangered galliwasp (assigned a new genus in 2021) hails from the jungles of Haiti and the Dominican Republic. It is threatened by habitat loss and the illegal pet trade. The Nashville Zoo has kept a breeding colony of these lizards for several years; they are also inexplicably found in a few Texas facilities.
As I was perusing the thread today, I realized that I had actually seen this species just last September at the Toledo Zoo (on the upper floor of their Museum of Natural History)! It was definitely a new addition on that visit, and I’m glad to see that this species is still (?) represented in the country’s zoos.Family Megophryidae
Long-nosed Horned Frog (Pelobatrachus nasutus) – Gone?
Also called the Malayan Horned Frog or Malayan Leaf Frog, this distinctive species is similar to the Solomon Island leaf frog in its camouflage strategy. Unlike that species, however, I was not able to find evidence of this being kept in US collections currently. The most recent references to one on display was at Butterfly Wonderland (Arizona) in 2016, which seems to be absent now. It was also held at the California Academy of Sciences in 2011 and the Bronx Zoo in 2010, but is now absent from both. Over a dozen European zoos hold the species, as do the Singapore Zoo and a few places in Japan. Below is the only American photo I could find of the species.

Taken at Bronx Zoo by @fkalltheway

Attachments
I saw Common Wall Lizard (Podarcis muralis) signed at Brookfield yesterday, a species not listed in this thread.
Turtleman Florida
New Member
No Chaco tortoises ?Possible, but not that likely if I had to guess. More likely the desert tortoises in US zoos are derived from local animals, which would be either agassizii or morafkai.
South American and Giant Tortoises
We’ll be finishing up the tortoises – and thus all the chelonians – today with a banger: two of the largest reptiles on the planet. But before that – two smaller ones.
Red-footed Tortoise (Chelonoidis carbonarius) – Abundant
Yellow-footed Tortoise (Chelonoidis denticulata) – Prevalent to Common
It may come as a surprise that the Galapagos Tortoise has two smaller cousins on the mainland – until you remember that those island tortoises had to come from somewhere

Taken at the Naples Zoo by @red river hog
Galapagos Tortoise (Chelonoidis niger) – Abundant (mostly in AZA)
These famously large tortoises are the largest tortoises and one of the largest reptiles on Earth, with some individuals getting well over 800 lbs with carapaces 6 ft long. They are also one of the longest-lived vertebrates, with individuals known to have reached 175 years of age; incredibly, some of the Galapagos tortoises in American zoos are older than the zoos themselves!
Several islands in the archipelago are inhabited by different races of tortoise; there has been back-and-forth on whether to categorize these as subspecies, separate species, etc. Multiple types are present in the ~50 US zoos that hold them – microphyes, vicina, porteri, vandenburghi, etc – and there are some physical differences between the types. Most zoos simply sign them with the all-encompassing Chelonoidis niger, but significant efforts have been made in US zoos to have type-specific breeding herds. Some zoos with successful breeding results have been the San Diego Zoo, Riverbanks Zoo (of leaf-tailed gecko fame), and the Gladys Porter Zoo in Texas. Captive-bred tortoises from the States have been sent to the Galapagos for repopulation efforts, as these tortoises declined a lot in the past few centuries due to human activity.
A short explanation of some of the genetic work and collaborative breeding strategies of recent years: Galapagos Tortoise Research


Both Galapagos Tortoises, but with differing shells
Taken at the San Diego Zoo by @Coelacanth18 and @red river hog
Aldabra Giant Tortoise (Aldabrachelys gigantea) – Abundant
Across the world on another set of islands, Nature produced another group of huge tortoises that have survived human contact. Native to the Seychelles off the coast of East Africa (mostly on the atoll of Aldabra), the Aldabra tortoise averages smaller than a Galapagos but is still easily the second largest tortoise. This species is somewhat more likely to be found outside of AZA zoos than Galapagos, although the large majority of holders are accredited. Despite being one of the most common reptiles in US zoos with ~85 holders, breeding this species has proven incredibly difficult; only a small handful of zoos have ever accomplished it, and the only zoo with a successful active breeding herd is the Tulsa Zoo with over 100 hatchlings since 2000.

Taken at the Pittsburgh Zoo by @Andrew_NZP
------------------------------------------
As with each group so far, there will be a summary post for chelonians; it will go up early next week and be followed by an introduction to our last major herp group. We're almost to the end, folks!
No Chaco tortoises ?
They showed up in the survey but barely. I must have overlooked them in the process of writing up blurbs for the other Chelonoidis species that are far more numerous.
Turtleman Florida
New Member
Thank you. I just figured maybe some zoos in the USA or outside the United States might be working with them.They showed up in the survey but barely. I must have overlooked them in the process of writing up blurbs for the other Chelonoidis species that are far more numerous.
With this thread having concluded 9 months ago and American Zootierliste debuting less than 2 months after it, I’ve had it in my mind that at some point I would revisit this project and re-evaluate it now that there is another full dataset to compare with. A more scrupulous scientist would probably let it cook a while longer, but the growth rate for new US ZTL additions has slowed considerably… and if I don’t do it soon while the analysis is still up-to-date I sort of wonder whether I’ll ever get around to redoing the analyses.
My main focus for now will be 1) comparing ZTL holdings to survey holdings for US zoos, and 2) comparing the data from both to holdings in Europe (given its the largest and most well-documented zoo region globally). At the moment I don’t have the appetite for a comprehensive analysis of every taxon, and frankly there’s a good chance I never will – so for now I plan on doing broad summary posts for each group, looking mainly at the ~25 most common species for each, and you can all enjoy and engage with the 5 or so posts I have. If anyone is curious about certain species or comparisons that *wouldn’t* take me several hours to investigate, feel free to throw them out there and I may do follow-ups.
Amphibians
I’ve compiled the holdings for what I now believe to be the 22 most common amphibian species in US captive collections… probably.
Something to keep in mind: the numbers on ZTL are constantly changing, so please don’t @ me if some frog is actually 77 now and not 75. I will double-check most listings before I post, but for some of the more complicated ones (ex. listings spread across many subspecies) the analysis might be a couple/few weeks outdated.
1. Dyeing Poison Dart Frog (Dendrobates tinctorius) – 100 holdings (68 Blue, 66 other – with a good amount of overlap)
2. Axolotl (Ambystoma mexicanum) – 97 holdings
3. Green-and-black Poison Dart Frog (Dendrobates auratus) – 94 holdings
4. Yellow-banded Poison Dart Frog (Dendrobates leucomelas) – 76 holdings
5. Amazon Milk Frog (Trachycephalus resinifictrix) – 47 holdings
6. Hellbender (Cryptobranchus alleganiensis) – 46 holdings
7. (tie) Panamanian Golden Frog (Atelopus zeteki/varius) – 41 holdings
7. (tie) Cane Toad (Rhinella marina) – 41 holdings
9. African Bullfrog (Pyxis adspersus) – 37 holdings
10. Anthony’s (Phantasmal) Poison Dart Frog (Epipedobates anthonyi) – 36 holdings
11. Golden Poison Dart Frog (Phyllobates terribilis) – 35 holdings
12. American Bullfrog (Lithobates catesbeianus) – 34 holdings
13. (tie) White’s Tree Frog (Ranoidea caerulea) – 32 holdings
13. (tie) Barred Tiger Salamander (Ambystoma mavortium) – 32 holdings
15. (tie) American Toad (Anaxyrus americanus) – 31 holdings
15. (tie) American Green Tree Frog (Dryophytes cinereus) – 31 holdings
15. (tie) Gray Tree Frog (Dryophytes versicolor) – 31 holdings
18. Red-eyed Tree Frog (Agalychnis callidryas) – 29 holdings
19. Colorado River Toad (Incilius alvarius) – 27 holdings
20. Golfodulcean Poison Dart Frog (Phyllobates vittatus) – 26 holdings
21. Eastern Newt (Notophthalmus viridescens) – 25 holdings
One species – the Eastern Tiger Salamander (Ambystoma tigrinum) is officially only at 20 holdings, but given that the vast majority of ~75 Ambystoma holdings that can’t be verified to species level are probably Eastern, I’d expect they're easily in the top 5. I didn’t do any further analysis on A. tigrinum though, for this reason.

A true enigma, nobody knows their true identity…
Tiger Salamander; taken by @Semioptera at Downtown Aquarium Houston
US Survey Count vs US ZTL Holdings
Comparing my survey holdings to ZTL holdings, my count rate varied widely. My most accurate count was for Panamanian Golden Frog, for which I apparently nailed the count exactly (41 vs 41); this makes sense given its an AZA breeding program only held at well-known, well-documented facilities. My worst rate was for Axolotl, with my survey capturing just under 30% of ZTL holdings; that being said, the Ambystoma holdings were largely entered systematically by ZTL staff rather than piecemeal by random users like most species. My next worst capture rate was for Eastern Newt at 44%.
My average capture rate across 21 common species was 67%, which is slightly better than I expected. That breaks down to 58% for 8 native species and 73% for 13 exotic species; I already knew my survey undercounted native-focused facilities and this data seems to validate that. Native collections often make up a sizable block of holders for native species: half to two-thirds of holders for American Bullfrogs, American Toads, Eastern Newts and native tree frogs are native collections. On the flip side, most holders of Hellbender, Colorado River Toad and Barred Tiger Salamander are traditional zoos and aquariums – so it’s not a universal truth that native species are found in nature centers, apparently.

Perhaps the sweating of an illegal substance makes it hard for minor-league nature centers to get in the desert toad game?
Sonoran Desert Toad; taken by @evilmonkey239 at Toledo Zoo
In my amphibian survey recap, I found 5 species to be Abundant (40+ holders) and 6 species to be Very Common (30-39 holders). Based on current ZTL data, there are actually 9 Abundant and 9 to 10 Very Common species, so my survey did underestimate abundance by a sizable clip. Of the 22 common species I looked at, 13 (more than half) should have had their abundance category adjusted up by one (Common to Very Common, Very Common to Abundant, etc) while 9 had been estimated accurately – but 5 of those 9 had already been estimated as Abundant (the highest category possible) and I still numerically underestimated some of these so I think it's questionable to even count them as successful.
Overall, my feelings are mixed on whether the abundance was a useful or accurate metric – I wasn’t *dramatically* wrong for any species, but I wasn’t spot on for most of them either. Of course, I’m guessing my estimates were better for the vast majority of rarer species – so maybe it’s not that big a deal.

Counting can be hard, but it’s easier when you only have to count to one.
Lehmann's Poison Frog; taken by @jayjds2 at Dallas World Aquarium
Something else interesting was looking at AZA accredited vs non-accredited facilities, since the two frequently diverge on types of species held. I didn’t do a species-by-species analysis for this stat, but I did look into it generally. Panamanian Golden Frog (an AZA breeding program) was 100% accredited holdings. Amazon Milk Frog was also highly concentrated in AZA facilities at ~95%, which might explain why my survey count was so accurate for that species too (only off by a couple holders). White’s Tree Frog was notably more common in non-accredited facilities, with roughly 2 in 3 holders being outside the AZA – and unsurprisingly my survey count undershot their holdings by at least 40%.
I also decided to test how much my survey captured holdings overall. I compared the overall holdings between the survey and ZTL for 8 amphibian families:
Phyllomedusidae (Leaf Tree Frogs) = 74/78 (95%)
Lungless Salamanders = 47/50 (94%)
Mantellas = 52/57 (91%)
Clawed Frogs = 27/32 (84%)
Poison Dart Frogs = 340/454 (75%)
Toads = 208/291 (72%)
Horned Frogs = 21/33 (64%)
Ranidae (True Frogs) = 50/94 (53%)
So a pretty wide range, with no clearly discernable pattern I can make out. My assumption would be that native groups would have lower effective capture rates on the whole than exotic groups, but with Plethodontidae being 94% and Ranidae being 53% that turned out to be too broad a generalization to make.
US ZTL Holdings vs Europe ZTL Holdings
Note: this comparison will not be a strong focus for these posts in general - partly because it's a lot of work to do in-depth, and partly because I get the feeling someone might attempt their own thread on this at some point.
For the comparison between Europe and the US, I analyzed native and exotic species separately. Unsurprisingly, of the 8 native species I looked at the US has on average 8.5x more captive holdings than Europe; the only native species I looked at that isn’t rare in European collections is the Colorado River Toad, which has about equal holdings in Europe as we do here. For exotic species, the US on average has 47% of Europe’s holding per species for the 11* species I looked at. This ranged from 69% for Green-and-black PDF to 25% for White’s Tree Frog. Main takeaway is, for common exotic amphibians Europe has twice as many holders as the US on average. Whether this holds true for rarer species, I can’t say for sure – but based on anecdotal perusing it seems likely that’s the case.
*I excluded Dyeing Poison Frog because I didn’t have the mental energy to compile Europe’s holdings across types. I also excluded Panamanian Golden Frog because it is absent from European collections.
The total European holdings for these species don’t reveal too much surprising. White’s Tree Frogs are notably more common there than here; whether this is reality or an artifact of America’s non-accredited facilities (where White’s are encountered more often) being less well-documented than Europe’s remains a question for the future, I guess.

You’d think having more amphibians than us would make Europe feel pretty secure about their holdings... so why the need for so many of the world’s most indestructible frogs?
Australian Green Tree Frog; taken by @WhistlingKite24 at Alexandra Park Zoo (Australia)
And that’s it for the first analysis. Not sure when the next post (lizards) will go up, but I'm hoping to have it ready by at least next week if not earlier.
My main focus for now will be 1) comparing ZTL holdings to survey holdings for US zoos, and 2) comparing the data from both to holdings in Europe (given its the largest and most well-documented zoo region globally). At the moment I don’t have the appetite for a comprehensive analysis of every taxon, and frankly there’s a good chance I never will – so for now I plan on doing broad summary posts for each group, looking mainly at the ~25 most common species for each, and you can all enjoy and engage with the 5 or so posts I have. If anyone is curious about certain species or comparisons that *wouldn’t* take me several hours to investigate, feel free to throw them out there and I may do follow-ups.
Amphibians
I’ve compiled the holdings for what I now believe to be the 22 most common amphibian species in US captive collections… probably.
Something to keep in mind: the numbers on ZTL are constantly changing, so please don’t @ me if some frog is actually 77 now and not 75. I will double-check most listings before I post, but for some of the more complicated ones (ex. listings spread across many subspecies) the analysis might be a couple/few weeks outdated.
1. Dyeing Poison Dart Frog (Dendrobates tinctorius) – 100 holdings (68 Blue, 66 other – with a good amount of overlap)
2. Axolotl (Ambystoma mexicanum) – 97 holdings
3. Green-and-black Poison Dart Frog (Dendrobates auratus) – 94 holdings
4. Yellow-banded Poison Dart Frog (Dendrobates leucomelas) – 76 holdings
5. Amazon Milk Frog (Trachycephalus resinifictrix) – 47 holdings
6. Hellbender (Cryptobranchus alleganiensis) – 46 holdings
7. (tie) Panamanian Golden Frog (Atelopus zeteki/varius) – 41 holdings
7. (tie) Cane Toad (Rhinella marina) – 41 holdings
9. African Bullfrog (Pyxis adspersus) – 37 holdings
10. Anthony’s (Phantasmal) Poison Dart Frog (Epipedobates anthonyi) – 36 holdings
11. Golden Poison Dart Frog (Phyllobates terribilis) – 35 holdings
12. American Bullfrog (Lithobates catesbeianus) – 34 holdings
13. (tie) White’s Tree Frog (Ranoidea caerulea) – 32 holdings
13. (tie) Barred Tiger Salamander (Ambystoma mavortium) – 32 holdings
15. (tie) American Toad (Anaxyrus americanus) – 31 holdings
15. (tie) American Green Tree Frog (Dryophytes cinereus) – 31 holdings
15. (tie) Gray Tree Frog (Dryophytes versicolor) – 31 holdings
18. Red-eyed Tree Frog (Agalychnis callidryas) – 29 holdings
19. Colorado River Toad (Incilius alvarius) – 27 holdings
20. Golfodulcean Poison Dart Frog (Phyllobates vittatus) – 26 holdings
21. Eastern Newt (Notophthalmus viridescens) – 25 holdings
One species – the Eastern Tiger Salamander (Ambystoma tigrinum) is officially only at 20 holdings, but given that the vast majority of ~75 Ambystoma holdings that can’t be verified to species level are probably Eastern, I’d expect they're easily in the top 5. I didn’t do any further analysis on A. tigrinum though, for this reason.
A true enigma, nobody knows their true identity…
Tiger Salamander; taken by @Semioptera at Downtown Aquarium Houston
US Survey Count vs US ZTL Holdings
Comparing my survey holdings to ZTL holdings, my count rate varied widely. My most accurate count was for Panamanian Golden Frog, for which I apparently nailed the count exactly (41 vs 41); this makes sense given its an AZA breeding program only held at well-known, well-documented facilities. My worst rate was for Axolotl, with my survey capturing just under 30% of ZTL holdings; that being said, the Ambystoma holdings were largely entered systematically by ZTL staff rather than piecemeal by random users like most species. My next worst capture rate was for Eastern Newt at 44%.
My average capture rate across 21 common species was 67%, which is slightly better than I expected. That breaks down to 58% for 8 native species and 73% for 13 exotic species; I already knew my survey undercounted native-focused facilities and this data seems to validate that. Native collections often make up a sizable block of holders for native species: half to two-thirds of holders for American Bullfrogs, American Toads, Eastern Newts and native tree frogs are native collections. On the flip side, most holders of Hellbender, Colorado River Toad and Barred Tiger Salamander are traditional zoos and aquariums – so it’s not a universal truth that native species are found in nature centers, apparently.
Perhaps the sweating of an illegal substance makes it hard for minor-league nature centers to get in the desert toad game?
Sonoran Desert Toad; taken by @evilmonkey239 at Toledo Zoo
In my amphibian survey recap, I found 5 species to be Abundant (40+ holders) and 6 species to be Very Common (30-39 holders). Based on current ZTL data, there are actually 9 Abundant and 9 to 10 Very Common species, so my survey did underestimate abundance by a sizable clip. Of the 22 common species I looked at, 13 (more than half) should have had their abundance category adjusted up by one (Common to Very Common, Very Common to Abundant, etc) while 9 had been estimated accurately – but 5 of those 9 had already been estimated as Abundant (the highest category possible) and I still numerically underestimated some of these so I think it's questionable to even count them as successful.
Overall, my feelings are mixed on whether the abundance was a useful or accurate metric – I wasn’t *dramatically* wrong for any species, but I wasn’t spot on for most of them either. Of course, I’m guessing my estimates were better for the vast majority of rarer species – so maybe it’s not that big a deal.
Counting can be hard, but it’s easier when you only have to count to one.
Lehmann's Poison Frog; taken by @jayjds2 at Dallas World Aquarium
Something else interesting was looking at AZA accredited vs non-accredited facilities, since the two frequently diverge on types of species held. I didn’t do a species-by-species analysis for this stat, but I did look into it generally. Panamanian Golden Frog (an AZA breeding program) was 100% accredited holdings. Amazon Milk Frog was also highly concentrated in AZA facilities at ~95%, which might explain why my survey count was so accurate for that species too (only off by a couple holders). White’s Tree Frog was notably more common in non-accredited facilities, with roughly 2 in 3 holders being outside the AZA – and unsurprisingly my survey count undershot their holdings by at least 40%.
I also decided to test how much my survey captured holdings overall. I compared the overall holdings between the survey and ZTL for 8 amphibian families:
Phyllomedusidae (Leaf Tree Frogs) = 74/78 (95%)
Lungless Salamanders = 47/50 (94%)
Mantellas = 52/57 (91%)
Clawed Frogs = 27/32 (84%)
Poison Dart Frogs = 340/454 (75%)
Toads = 208/291 (72%)
Horned Frogs = 21/33 (64%)
Ranidae (True Frogs) = 50/94 (53%)
So a pretty wide range, with no clearly discernable pattern I can make out. My assumption would be that native groups would have lower effective capture rates on the whole than exotic groups, but with Plethodontidae being 94% and Ranidae being 53% that turned out to be too broad a generalization to make.
US ZTL Holdings vs Europe ZTL Holdings
Note: this comparison will not be a strong focus for these posts in general - partly because it's a lot of work to do in-depth, and partly because I get the feeling someone might attempt their own thread on this at some point.
For the comparison between Europe and the US, I analyzed native and exotic species separately. Unsurprisingly, of the 8 native species I looked at the US has on average 8.5x more captive holdings than Europe; the only native species I looked at that isn’t rare in European collections is the Colorado River Toad, which has about equal holdings in Europe as we do here. For exotic species, the US on average has 47% of Europe’s holding per species for the 11* species I looked at. This ranged from 69% for Green-and-black PDF to 25% for White’s Tree Frog. Main takeaway is, for common exotic amphibians Europe has twice as many holders as the US on average. Whether this holds true for rarer species, I can’t say for sure – but based on anecdotal perusing it seems likely that’s the case.
*I excluded Dyeing Poison Frog because I didn’t have the mental energy to compile Europe’s holdings across types. I also excluded Panamanian Golden Frog because it is absent from European collections.
The total European holdings for these species don’t reveal too much surprising. White’s Tree Frogs are notably more common there than here; whether this is reality or an artifact of America’s non-accredited facilities (where White’s are encountered more often) being less well-documented than Europe’s remains a question for the future, I guess.
You’d think having more amphibians than us would make Europe feel pretty secure about their holdings... so why the need for so many of the world’s most indestructible frogs?
Australian Green Tree Frog; taken by @WhistlingKite24 at Alexandra Park Zoo (Australia)
And that’s it for the first analysis. Not sure when the next post (lizards) will go up, but I'm hoping to have it ready by at least next week if not earlier.