Given the diversity of our membership - I thought it would be interesting to discuss the impacts of COVID-19 around the world.
There is quite a bit of difference in infection rates and death rates - some countries had large infections early on and so their infection rates and death rates are higher.
Other countries (such as NZ and Australia) were fortunately late in their infection rates and had the benefit of observing the issues in other countries - especially in Europe - and locked down relatively early and have so far managed to avoid significant issue. The fact that we are also islands helps immensely here too. The only thing that really let us down was those damned cruise ships
I was trying to point out on another site that you can't compare raw numbers of infections and deaths without considering population size. So I decided to create a table with data showing infection rates and death rates per head of population so we can start to compare more meaningful data.
I thought people on ZooChat might find it interesting too.
All population data comes from Wikipedia, while case and death data comes from the John Hopkins University COVID-19 tracker website.
I originally started with about 8 countries, and was surprised to see the US so far down the list. But then someone pointed out that infections are concentrated in certain areas - so I started breaking the data down by state, which gave a much more accurate picture of the situation. I've included all US states with more than 20,000 cases.
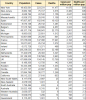
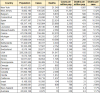
Here is my table sorted by cases per million population:

... as you can see, New York is by far the worst hit - well over 1% of the population has now been infected. Only New Jersey comes close to matching that infection rate.
Louisiana and Massachusetts also far exceed the infection rates of Spain, while Switzerland and Belgium have more cases per head of population than Italy does!
It's not really fair to break the US down by state but then compare it to other entire countries, but that's all the data I have available. Only the US, China, Canada and Australia have state/province level data on the John Hopkins Uni website.
It's also important to understand that infection rates are largely determined by the amount of testing that is being done. In many countries - there would undoubtedly be a high number of undetected cases, especially amongst the younger population who may be asymptomatic and thus won't know to go and get tested. So while
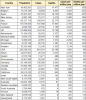
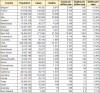
Here is the table sorted by death rate per head of population:

The key thing to remember here is that it can take some time for an infected person to deteriorate in health and die. That means that recently infected people who are going to die will take some time to show up in the stats - and countries which were late to have high rates of infection won't necessarily have a death rate to match yet.
Population demographics will also have an impact on death rates. Areas with an older population will be worse off, as will areas with populations that already have poor health.
Again, New York is by far the worst affected area - but surprisingly, Belgium and Spain are now far worse than Italy on a per-capita basis.
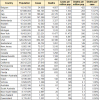
One other factor to consider is how many of the infected people die. Again, this will be impacted by the amount of testing - more tests = higher detection rates. But I've read that some countries are not counting deaths the same way - in some cases only hospital based deaths are counted and in others, deaths from factors other than the respiratory COVID-19 aren't necessarily counted as a COVID-19 death - so this data isn't necessarily accurate for comparison purposes between countries.
So this final table is the same data sorted by deaths per case.

It's the European countries which are seeing the highest death rates - but I suspect there is a combination of demographics and differences in measurement which are impacting this data.
There is quite a bit of difference in infection rates and death rates - some countries had large infections early on and so their infection rates and death rates are higher.
Other countries (such as NZ and Australia) were fortunately late in their infection rates and had the benefit of observing the issues in other countries - especially in Europe - and locked down relatively early and have so far managed to avoid significant issue. The fact that we are also islands helps immensely here too. The only thing that really let us down was those damned cruise ships
I was trying to point out on another site that you can't compare raw numbers of infections and deaths without considering population size. So I decided to create a table with data showing infection rates and death rates per head of population so we can start to compare more meaningful data.
I thought people on ZooChat might find it interesting too.
All population data comes from Wikipedia, while case and death data comes from the John Hopkins University COVID-19 tracker website.
I originally started with about 8 countries, and was surprised to see the US so far down the list. But then someone pointed out that infections are concentrated in certain areas - so I started breaking the data down by state, which gave a much more accurate picture of the situation. I've included all US states with more than 20,000 cases.
Here is my table sorted by cases per million population:
... as you can see, New York is by far the worst hit - well over 1% of the population has now been infected. Only New Jersey comes close to matching that infection rate.
Louisiana and Massachusetts also far exceed the infection rates of Spain, while Switzerland and Belgium have more cases per head of population than Italy does!
It's not really fair to break the US down by state but then compare it to other entire countries, but that's all the data I have available. Only the US, China, Canada and Australia have state/province level data on the John Hopkins Uni website.
It's also important to understand that infection rates are largely determined by the amount of testing that is being done. In many countries - there would undoubtedly be a high number of undetected cases, especially amongst the younger population who may be asymptomatic and thus won't know to go and get tested. So while
Here is the table sorted by death rate per head of population:
The key thing to remember here is that it can take some time for an infected person to deteriorate in health and die. That means that recently infected people who are going to die will take some time to show up in the stats - and countries which were late to have high rates of infection won't necessarily have a death rate to match yet.
Population demographics will also have an impact on death rates. Areas with an older population will be worse off, as will areas with populations that already have poor health.
Again, New York is by far the worst affected area - but surprisingly, Belgium and Spain are now far worse than Italy on a per-capita basis.
One other factor to consider is how many of the infected people die. Again, this will be impacted by the amount of testing - more tests = higher detection rates. But I've read that some countries are not counting deaths the same way - in some cases only hospital based deaths are counted and in others, deaths from factors other than the respiratory COVID-19 aren't necessarily counted as a COVID-19 death - so this data isn't necessarily accurate for comparison purposes between countries.
So this final table is the same data sorted by deaths per case.
It's the European countries which are seeing the highest death rates - but I suspect there is a combination of demographics and differences in measurement which are impacting this data.