VirusChat: COVID-19 Statistics

Simon Hampel

Administrator
Staff member
20+ year member
For the past few months, I've been updating a spreadsheet every week with updated stats showing COVID-19 infection and death rates per head of population from around the world. The spreadsheet updates were a very manual process, so I started to automate the collection of some of the data. This eventually lead me to creating a web application where I could visualise the data in ways that other websites wouldn't let me.

It's still a work in progress - but here is the first release of the VirusChat :: COVID-19 Statistics website.

(No, I'm not planning on starting a new forum for VirusChat - I just happened to have the domain viruschat.com.au sitting around unused :p )

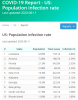
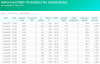
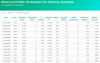
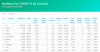
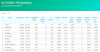
So far I have a table showing various statistics by country, plus tables for Australia, US and the UK showing data by state (or country/territory in the case of the UK).

upload_2020-8-11_16-35-9.png

upload_2020-8-11_16-35-24.png


... the columns are sortable - click on the heading to sort by that column.

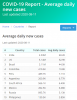
I do plan on adding more statistics and charts for comparison purposes.

Data collection is automated and pulled directly from the JHU COVID-19 data which is updated at least daily.

There may be some delay in seeing current data compared to what we see published locally - I have to wait for JHU to publish their updates which typically happens around 3pm Sydney time each day (5AM UTC).
 

Attachments

  • upload_2020-8-11_16-35-9.png
    upload_2020-8-11_16-35-9.png
    119.5 KB · Views: 6
  • upload_2020-8-11_16-35-24.png
    upload_2020-8-11_16-35-24.png
    117.3 KB · Views: 6
I'll summarise what each column in the tables means (most of this info is summarised at the bottom of each page):

  • Cases: the number of confirmed cases as reported to JHU
  • Average daily cases: a 7 day moving average of new cases (each day, we average the number of new cases from the past 7 days)
  • Cases growth level: see post below
  • R number: compare today's moving average of new cases with yesterday's moving average of new cases. If R number > 0, then average new cases is growing - shows potentially exponential growth. If R number < 0, then average new cases is shrinking - shows spread is being contained. We only show R number if there are at least 100 new cases being found each day on average.
  • Infection %: the percentage of the population that has been infected
  • Deaths: the number of deaths as reported to JHU
  • Average daily deaths: a 7 day moving average of new deaths reported each day
  • Death growth level: see post below
  • Deaths per mil pop: the number of deaths per million head of population
  • Deaths per case: the number of deaths divided by the number of cases
 
Case growth level:

This is a new measure that I've invented to give an indication of the relative growth in daily new cases on a week-on-week basis.

This is an exponential indicator, so +2 is 10 times higher than +1, while +3 is 10 times higher than +2, etc.

Here's how it is calculated:

  1. we start by calculating the number of new cases each day
  2. calculate a 7-day moving average of those daily new cases
  3. we compare today's average new cases with the average new cases from 1 week ago
  4. if today's average is higher (new cases is growing) then the number is positive, if it is lower, the number is negative
  5. we calculate the growth level using a factor of 10 based on the following table:
  • +4 Tens of thousands (+10,000 to +99,999)
  • +3 Thousands (+1,000 to +9,999)
  • +2 Hundreds (+100 to +999)
  • +1 Tens (+10 to +99)
  • 0 Less than 10 (-9 to +9)
  • -1 Tens (-10 to -99)
  • -2 Hundreds (-100 to -999)
  • -3 Thousands (-1,000 to -9,999)
  • -4 Tens of thousands (-10,000 to -99,999)
When looking at the figures, if a country has a +3 growth level, you should read this as "that country has seen thousands of new cases added in the past week".

Hint: the number represents x in the power 10^x ... so 10^1 = 10, 10^2 = 10x10 = 100, 10^3 = 10x10x10 = 1,000, etc

If a country has a +4 growth level, you should read this as "that country has seen tens-of-thousands of new cases added in the past week"

A growth level of 0 means "almost zero growth, could be positive, could be negative - but not much change"

Right now Australia has a -1 growth level, which means that this week's average daily new cases is "tens" less than it was at this time last week. It's shrinking - but not very fast.

No country has yet reached +5 growth level (100,000+ new cases in a day)
 
Boy do you love your statistics...:P :D!

Interesting information Simon!
 
I've release v1.1 of the VirusChat website.

Fixes:
  • some tidy up of the page layout
  • fixed some sorting issues with one of the table columns (Growth level)
New features:
  • Reports - simpler versions of each table focused around only the important data for each column
upload_2020-8-13_13-41-20.png


upload_2020-8-13_13-41-28.png
 

Attachments

  • upload_2020-8-13_13-41-20.png
    upload_2020-8-13_13-41-20.png
    76.4 KB · Views: 6
  • upload_2020-8-13_13-41-28.png
    upload_2020-8-13_13-41-28.png
    81.6 KB · Views: 6
v2.0.0 has just been pushed live

Fixes:

Changes:
  • change date display to d MMM YYYY format to make it more universally understood
  • major rewrite of underlying path structure for consistency and extensibility
New features:
  • added tables showing historic data

We can now see historical data for each country and for selected states.

upload_2020-8-14_9-31-34.png


upload_2020-8-14_9-32-47.png


upload_2020-8-14_9-32-57.png
 

Attachments

  • upload_2020-8-14_9-31-34.png
    upload_2020-8-14_9-31-34.png
    135.3 KB · Views: 6
  • upload_2020-8-14_9-32-47.png
    upload_2020-8-14_9-32-47.png
    134.7 KB · Views: 6
  • upload_2020-8-14_9-32-57.png
    upload_2020-8-14_9-32-57.png
    128.9 KB · Views: 6
Back
Top