ZooChat is 16 years old!

Simon Hampel

Administrator
Staff member
20+ year member
... or at least it was back in October last year - I never got around to posting the anniversary stats like I had planned!

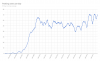
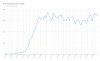
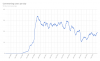
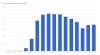
So as of 19th Oct 2019, we had almost 950,000 posts, just over 400,000 media uploads and close to 7,000 valid users (users who can post).

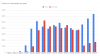
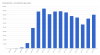
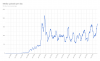
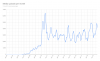
Here is a summary of some key statistics:

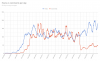
1. Overview as of 19th October 2019
  • 16 years since launch
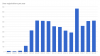
  • 16,428 users registered
  • 33,579 threads started
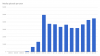
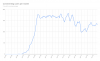
  • 561,435 posts written in threads
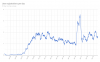
  • 402,547 media items uploaded
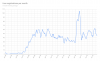
  • 387,699 media comments written
  • 949,134 total posts
  • 6,932 valid members have been permitted to post
  • 5,216 users have posted
  • 75.2% of our valid members have posted
  • 182.0 average posts made per user
  • 56 members have made 50% of all posts
  • 1.1% of posting users have made 50% of all posts
  • 5,160 members made the other 50% of posts
  • 1,248 users have uploaded media
  • 18.0% of our valid members have uploaded media
  • 322.6 average media uploads per user
  • 25 members have uploaded 50% of all media items
  • 2.0% of uploading users have made 50% of all uploads
  • 1,223 members made the other 50% of uploads

Previous anniversary stats:
Previous calendar year stats:
Other relevant stats threads:
 
2. Posts and media comments per day (90 day moving averages)

upload_2020-1-27_17-26-21.png

upload_2020-1-27_17-26-39.png

We treat posts and media comments as the same in totals.

In the previous version of the forum (prior to Oct 2016), media comments literally were posts and were not differentiated like they are in the current software.

For the newer members, the dramatic drop off in media comments in 2016 corresponds to the move to the new forum software (from vBulletin+PhotoPost to XenForo) which doesn't give us the same ability to see newly updated media comments that the old software did. This has been addressed in the new version of the XenForo forum software, but we're still a few months away from being ready to upgrade to that version.

It is interesting to note that there has been strong growth in forum posts lately, and even media comments have been picking up again.
 

Attachments

  • upload_2020-1-27_17-26-21.png
    upload_2020-1-27_17-26-21.png
    83 KB · Views: 107
  • upload_2020-1-27_17-26-39.png
    upload_2020-1-27_17-26-39.png
    67.6 KB · Views: 86
3. Posts and media comments per month (3 month moving averages)

upload_2020-1-27_17-32-42.png

upload_2020-1-27_17-32-59.png

I used to do these as bar charts - but with 16 years worth of data (192 months), there's too much information to show in a bar chart, so it's back to line charts.
 

Attachments

  • upload_2020-1-27_17-32-42.png
    upload_2020-1-27_17-32-42.png
    82.7 KB · Views: 91
  • upload_2020-1-27_17-32-59.png
    upload_2020-1-27_17-32-59.png
    69.9 KB · Views: 99
4. Posts and media comments per year

Each "year" is the 12 month period from Oct 19 through to Oct 18 the following year.

upload_2020-1-27_17-34-50.png

upload_2020-1-27_17-35-3.png
 

Attachments

  • upload_2020-1-27_17-34-50.png
    upload_2020-1-27_17-34-50.png
    42.7 KB · Views: 95
  • upload_2020-1-27_17-35-3.png
    upload_2020-1-27_17-35-3.png
    51.6 KB · Views: 106
Last edited:
5. Media uploads per day (90 day moving average)

upload_2020-1-28_14-53-27.png

Media upload volumes does seem to be a seasonal thing! Note that the 90 day moving average does warp the timing of the peaks somewhat - so the actual peak upload period for each year might not be quite as indicated on the chart (but it's close).

I'd suggest northern hemisphere summer is the peak upload period - but that's no real surprise given the demographic of our members (from a geographic perspective).
 

Attachments

  • upload_2020-1-28_14-53-27.png
    upload_2020-1-28_14-53-27.png
    72.2 KB · Views: 102
Last edited:
6. Media uploads per month (3 month moving average)

upload_2020-1-28_14-56-10.png
 

Attachments

  • upload_2020-1-28_14-56-10.png
    upload_2020-1-28_14-56-10.png
    82.7 KB · Views: 88
Last edited:
Really surprising to see that only 56 members made half of all posts and that only 25 members made half of all media uploads.
 
8. New user registrations per day (90 day moving average)

upload_2020-1-28_10-59-13.png

I still haven't worked out what happened in 2016. We didn't migrate to the new forum software until October 2016, so it wasn't that.

Note also that registration data isn't entirely complete. Several times in the past I have gone through a purging process to remove old/invalid users from the database. Typically this was users who had never posted and hadn't been online in several years, plus users whose account was never activated or users whose account was disabled because their email address was no longer valid - and again, they had never posted. There would also have been some spam users removed.

So as a result, the registrations per day chart above actually only shows currently valid users plus more recent invalid registrations.

The actual daily registration figures historically would be quite a bit higher - especially given that we have nearly 10,000 members who have registered but are not considered "valid" users (in that they either cannot post, or their account has already been purged from the system).
 

Attachments

  • upload_2020-1-28_10-59-13.png
    upload_2020-1-28_10-59-13.png
    67.1 KB · Views: 89
9. New user registrations per month (3 month moving average)

upload_2020-1-28_11-20-15.png
 

Attachments

  • upload_2020-1-28_11-20-15.png
    upload_2020-1-28_11-20-15.png
    80.4 KB · Views: 102
11. Posting users per day (90 day moving average)

"How many different users posted each day?"

upload_2020-1-28_14-5-30.png
 

Attachments

  • upload_2020-1-28_14-5-30.png
    upload_2020-1-28_14-5-30.png
    66.1 KB · Views: 97
12. Posting users per month (3 month moving average)

"How many different users post each month?"

upload_2020-1-28_14-12-37.png
 

Attachments

  • upload_2020-1-28_14-12-37.png
    upload_2020-1-28_14-12-37.png
    70.2 KB · Views: 92
13. Posting users per year

"How many different users have posted each year?"

upload_2020-1-28_14-17-7.png
 

Attachments

  • upload_2020-1-28_14-17-7.png
    upload_2020-1-28_14-17-7.png
    49.9 KB · Views: 109
14. Commenting users per day (90 day moving average)

"How many different users posted media comments each day?"

upload_2020-1-28_15-5-31.png
 

Attachments

  • upload_2020-1-28_15-5-31.png
    upload_2020-1-28_15-5-31.png
    65.3 KB · Views: 81
15. Commenting users per month (3 month moving average)

"How many different users posted media comments each month?"

upload_2020-1-28_15-10-18.png
 

Attachments

  • upload_2020-1-28_15-10-18.png
    upload_2020-1-28_15-10-18.png
    71.1 KB · Views: 96
Last edited:
Back
Top