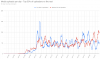
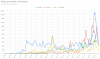
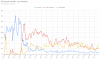
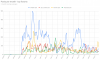
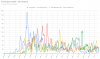
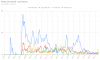
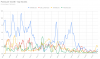
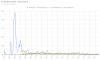
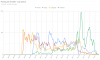
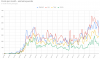
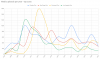
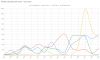
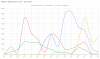
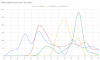
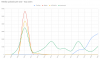
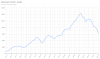
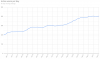
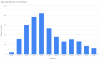
33. Media uploads per day - top 50% of uploaders vs the rest (90 day moving averages)
Let's do that same analysis for media uploads next.

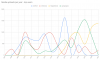
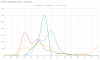
No real surprises there - and it's a lot more consistent than the posts. The main thing of note would be the early surge by our top uploaders - they got in early, and that head start makes it difficult for new comers to catch up.
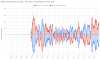
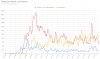
If we look at the difference between the two groups - it's much closer overall than the post chart - and it changes frequently. I suspect this is more based on the fact that media uploads tend to come less frequently, but in larger numbers - someone will go on a trip or visit a zoo, and then upload dozens (or even hundreds) of photos. This will skew the daily results one way of the other, depending on who it is doing the uploads.

Note that I removed the first couple of years of data because the data was quite extreme (ie for quite some time in the early days of the site, 100% of uploads were made by our bottom 50% of posters) and it was making it difficult to see the overall picture.
Again, I'm not sure if these charts actually mean much - but they still are quite pretty.
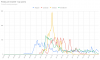
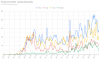
Let's do that same analysis for media uploads next.
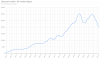
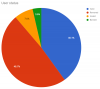
- From launch to our 18th anniversary, we've had 1,444 members upload media on ZooChat
- In that same period, we made 488,341 media uploads
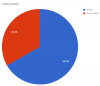
- I found that 29 members made 50% of the uploads - that's 2.0% of the members making 50% of the uploads
- In summary: if you have made at least 2,905 media uploads then you are in the top 50% of uploaders, if we measure it by contribution to the overall media total
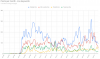
No real surprises there - and it's a lot more consistent than the posts. The main thing of note would be the early surge by our top uploaders - they got in early, and that head start makes it difficult for new comers to catch up.
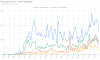
If we look at the difference between the two groups - it's much closer overall than the post chart - and it changes frequently. I suspect this is more based on the fact that media uploads tend to come less frequently, but in larger numbers - someone will go on a trip or visit a zoo, and then upload dozens (or even hundreds) of photos. This will skew the daily results one way of the other, depending on who it is doing the uploads.
Note that I removed the first couple of years of data because the data was quite extreme (ie for quite some time in the early days of the site, 100% of uploads were made by our bottom 50% of posters) and it was making it difficult to see the overall picture.
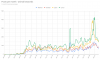
Again, I'm not sure if these charts actually mean much - but they still are quite pretty.